Employee Turnover Analysis with Machine Learning
Machine LearningA Classification model analyzing employee data to predict likelihood of turnover.
Technologies
- Python
- Jupyter Notebooks
- ML-Algorithms
Overview:
Employee Turnover Prediction Using Machine Learning
Employee retention is one of the most pressing challenges in HR analytics.
In this project, I explored a employee dataset to identify the factors
that drive turnover and to build predictive models that can help a company
recognize at-risk employees early. The workflow included Exploratory Data Analysis (EDA),
clustering to understand behavioral patterns (Kmeans-Clustering), handling class imbalance (SMOTE),
and testing three machine-learning
classifiers: Logistic Regression, Random Forest, and Gradient Boosting.
What the Analysis Showed
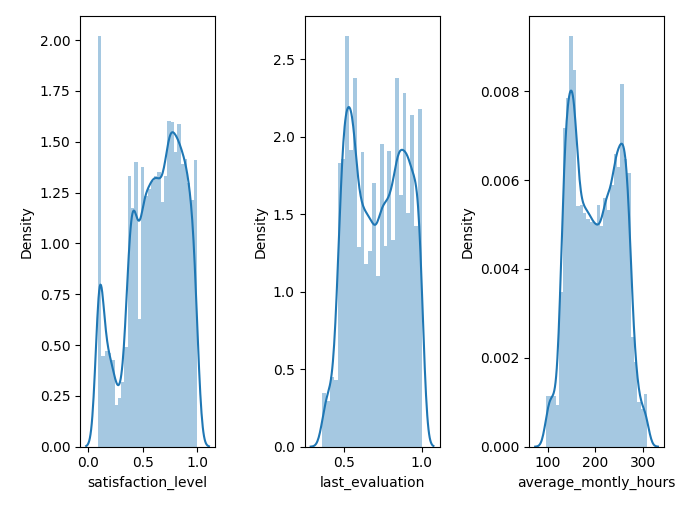
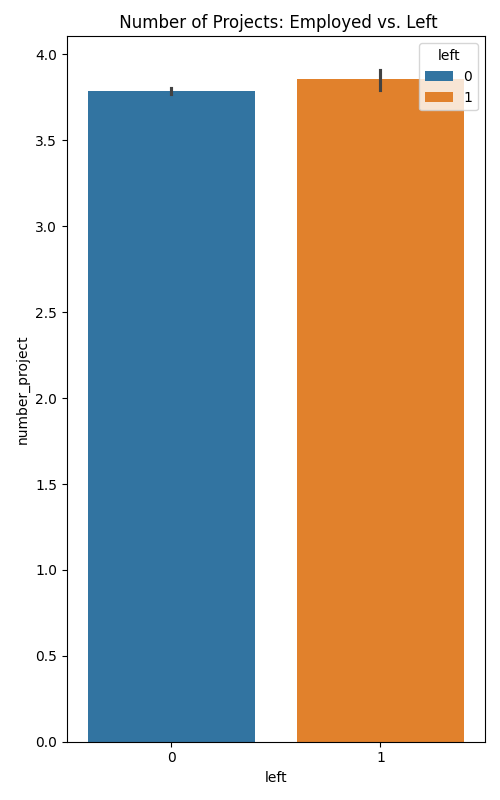
Exploratory analysis revealed several interesting patterns.
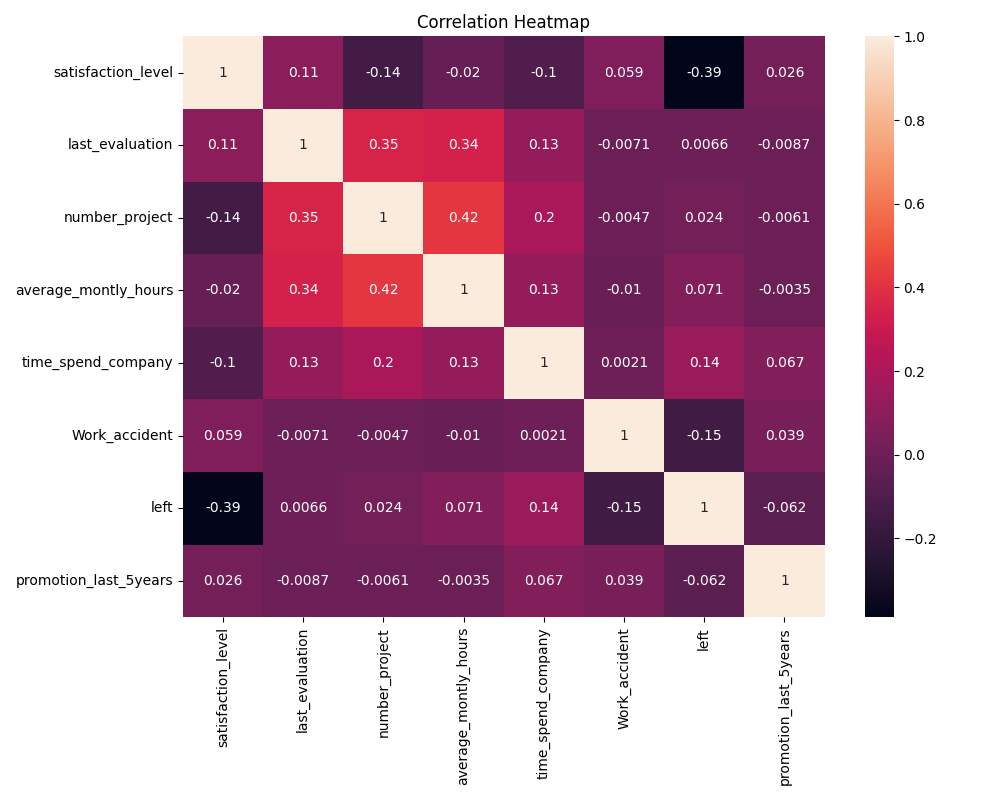
Satisfaction level had the strongest negative correlation with turnover,
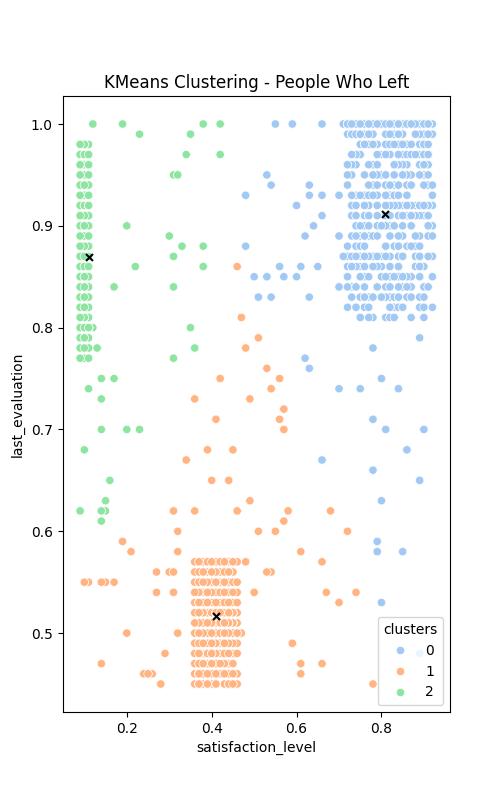
while high evaluation scores combined with low satisfaction appeared frequently
among employees who left. K-Means clustering helped isolate different types of
leavers—from overworked, underpaid high performers to employees who left for
better external opportunities. Salary and work hours also emerged as influential
factors.
Model Performance
Three models were trained and evaluated after balancing the data with SMOTE:
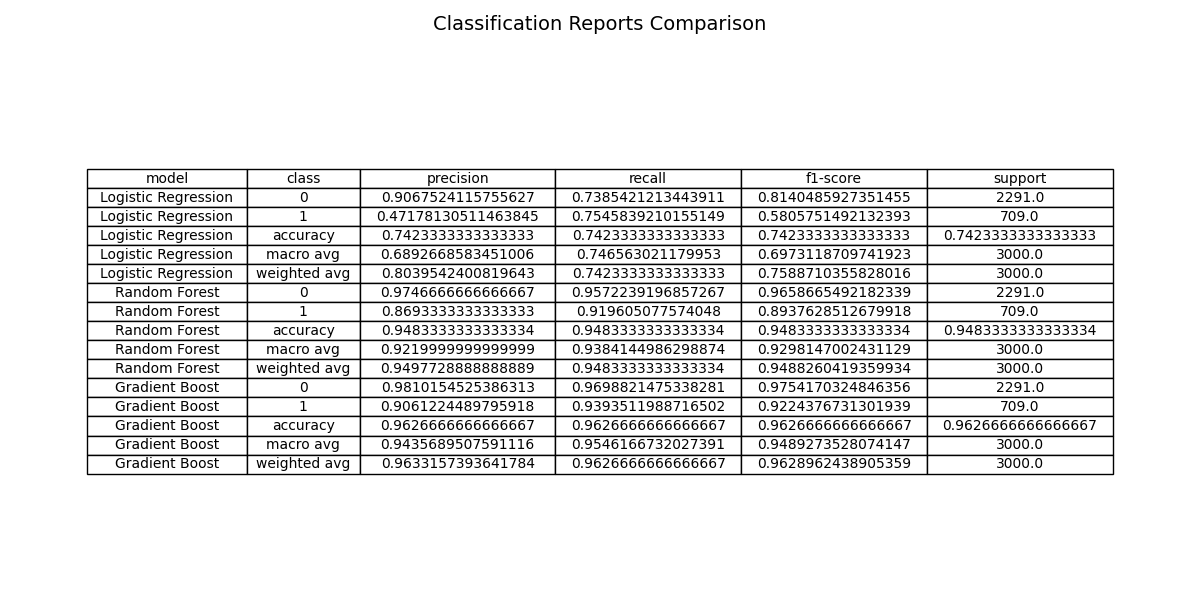
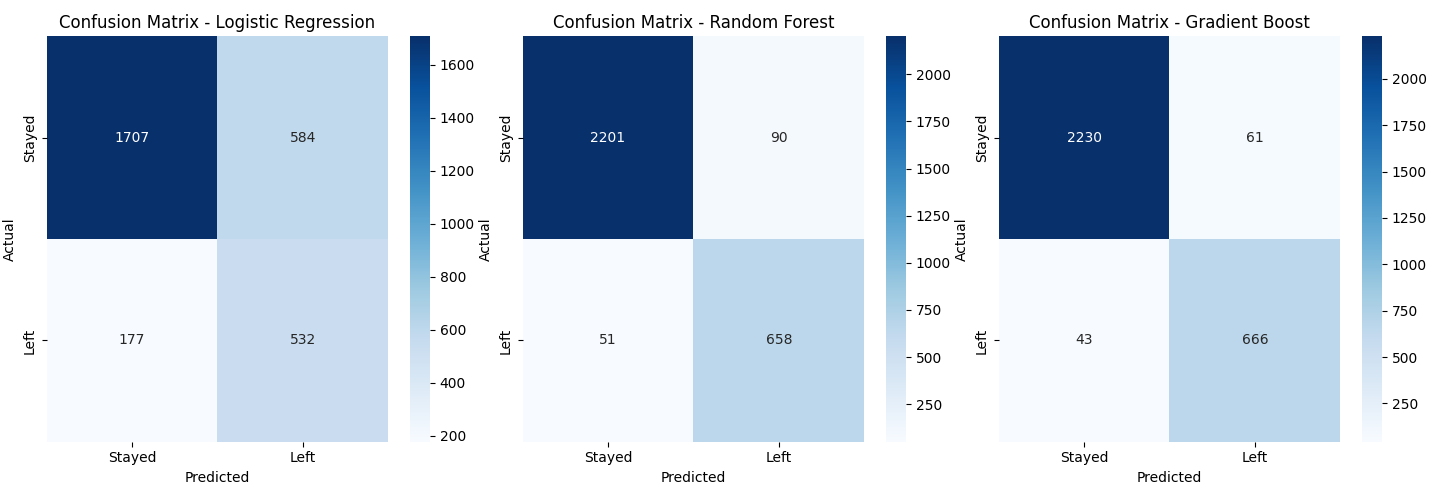
- Logistic Regression reached 74% accuracy but struggled with recall for employees who actually left.
- Random Forest improved performance significantly, with 93% accuracy, strong precision, and much better recall.
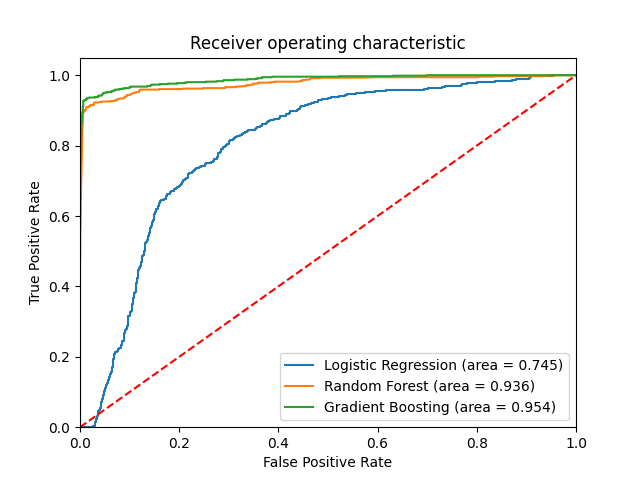
- Gradient Boosting delivered the best overall results with 96% accuracy, high precision, and the strongest f1-score for the “left” class.
These results were confirmed through cross-validation, classification reports, confusion matrices, and ROC/AUC curves.
Understanding the Metrics
Accuracy alone can be misleading in turnover prediction, because far fewer employees leave than stay.
A model might look “accurate” while still failing to identify the people most at risk.
That’s why the evaluation includes:
Precision: Of the employees predicted to leave, how many truly left?
Recall: The percentage of all employees who actually left that the model correctly identified.
F1-score: A balanced metric combining both precision and recall.
For HR decision-making, recall is especially critical. Missing a genuine future leaver is
far more costly than flagging someone who ultimately stays.
High recall ensures that most at-risk employees are detected early enough for meaningful intervention.
Best Model and Insights
Gradient Boosting emerged as the best-performing model overall. It showed the
highest recall for identifying employees who were likely to leave, making it
the most suitable tool for proactive retention strategies.
High-risk employees were further categorized using probability thresholds to
provide actionable guidance for HR teams.
Highlights:
-
Potential Retention Strategies
- Reduce excessive working hours
- Limit project overload
- Increase compensation for consistently high-performing employees
- These strategies focus on intervening where the data shows the highest risk of dissatisfaction or burnout.
Using the best model can predict the probability of employee turnover in the test data.
y_prob = model_gb.predict_proba(X_test) # print(y_prob) turnover_prob = y_prob[:, 1] # print(turnover_prob) safe_zone_threshold = 0.20 # 20% low_risk_zone_threshold = 0.40 # 40% moderate_risk_zone_threshold = 0.60 # 60% # High risk is anything above moderate risk # Categorize employees based on probability scores def categorize_employee(probability_score): if probability_score < safe_zone_threshold: return "Safe Zone (Green)" elif probability_score < low_risk_zone_threshold: return "Low Risk Zone (Yellow)" elif probability_score < moderate_risk_zone_threshold: return "Moderate Risk Zone (Orange)" else: return "High Risk Zone (Red)" # Categorize employees in the test set employee_categories = [categorize_employee(score) for score in turnover_prob] # Print the categorized employees for i, category in enumerate(employee_categories): print(f"Employee {i+1}: {category}")-
OutPut from the code:
Employee 23: Safe Zone (Green) Employee 24: Safe Zone (Green) Employee 25: Safe Zone (Green) Employee 26: Low Risk Zone (Yellow) Employee 27: Low Risk Zone (Yellow) Employee 28: High Risk Zone (Red) Employee 29: High Risk Zone (Red)
Based on the insights gained from the models and clusters, several data-driven actions can help reduce turnover:
Figures created during the different stages of the proejct